GUI
Workflow
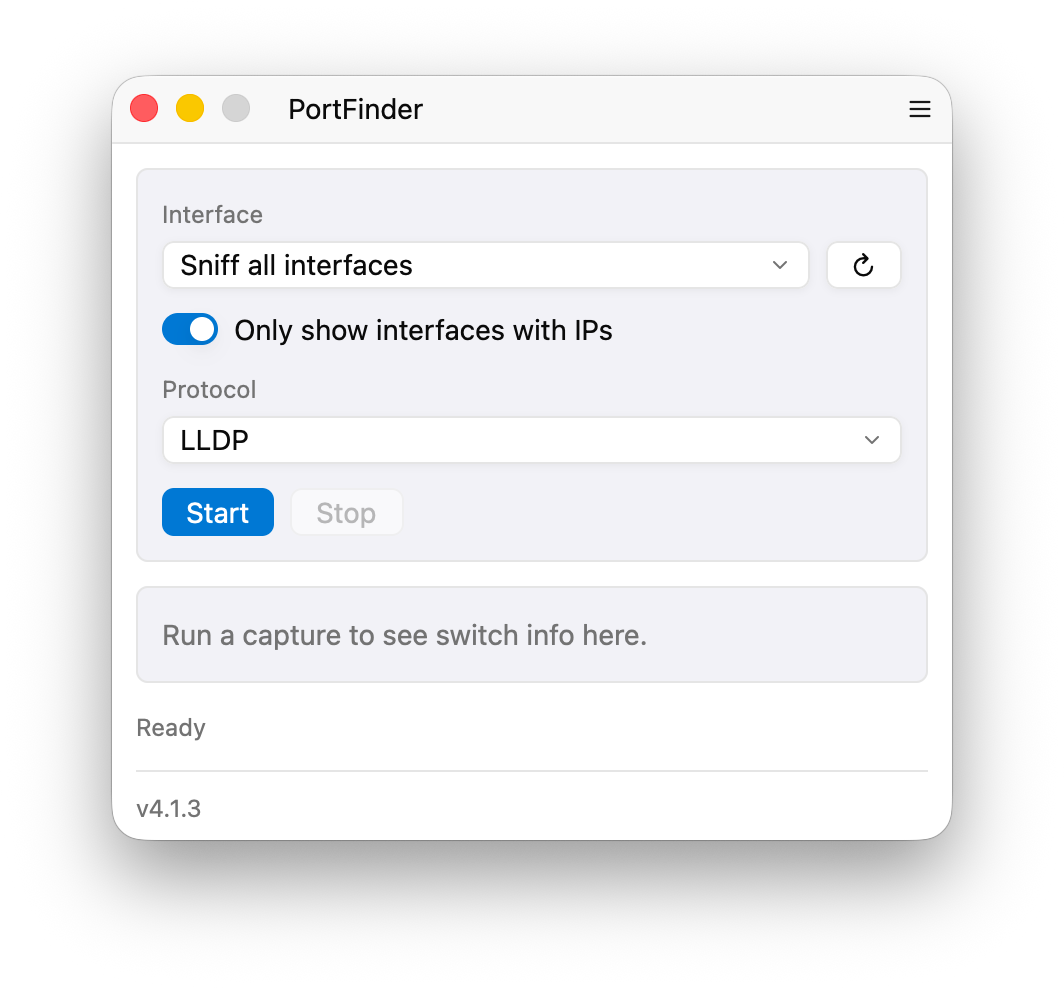
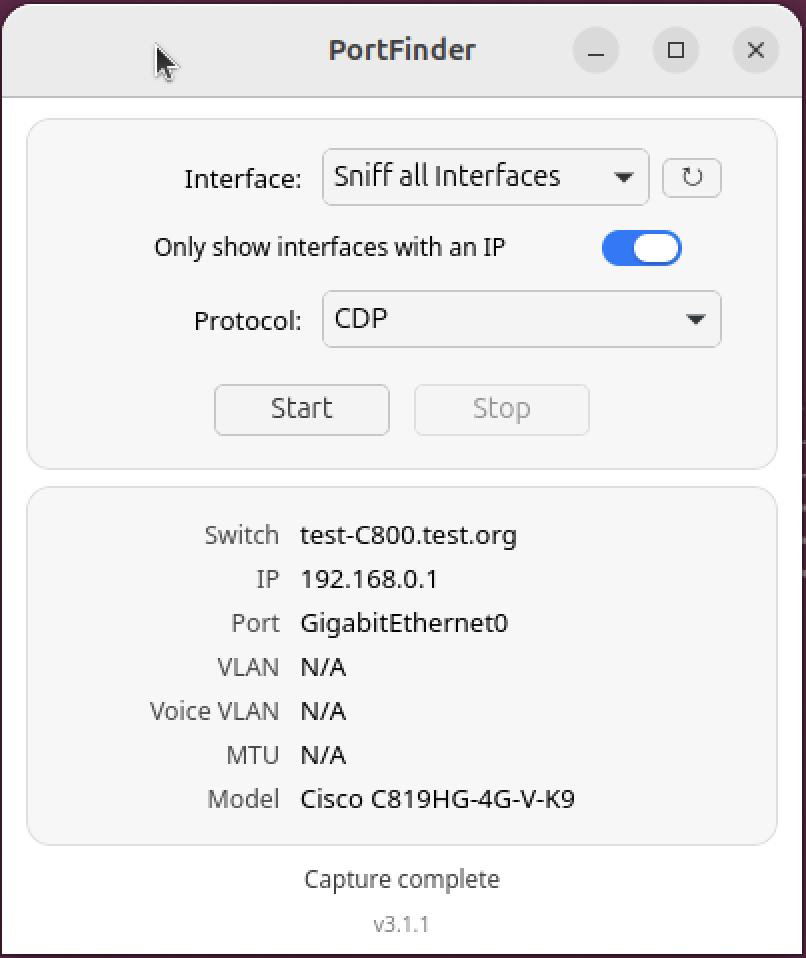
Section titled “Workflow”- Pick an interface. The dropdown shows every NIC on your machine. Use the toggle to hide interfaces with no IP. Hit the ↻ button to re-scan after plugging or unplugging cables.
- Pick the protocol. LLDP is the universal choice (Aruba, HP, Juniper, Extreme, Cisco, and MikroTik when you've enabled it). CDP is Cisco-only. MNDP is the MikroTik-only fallback for RouterOS devices that ship with
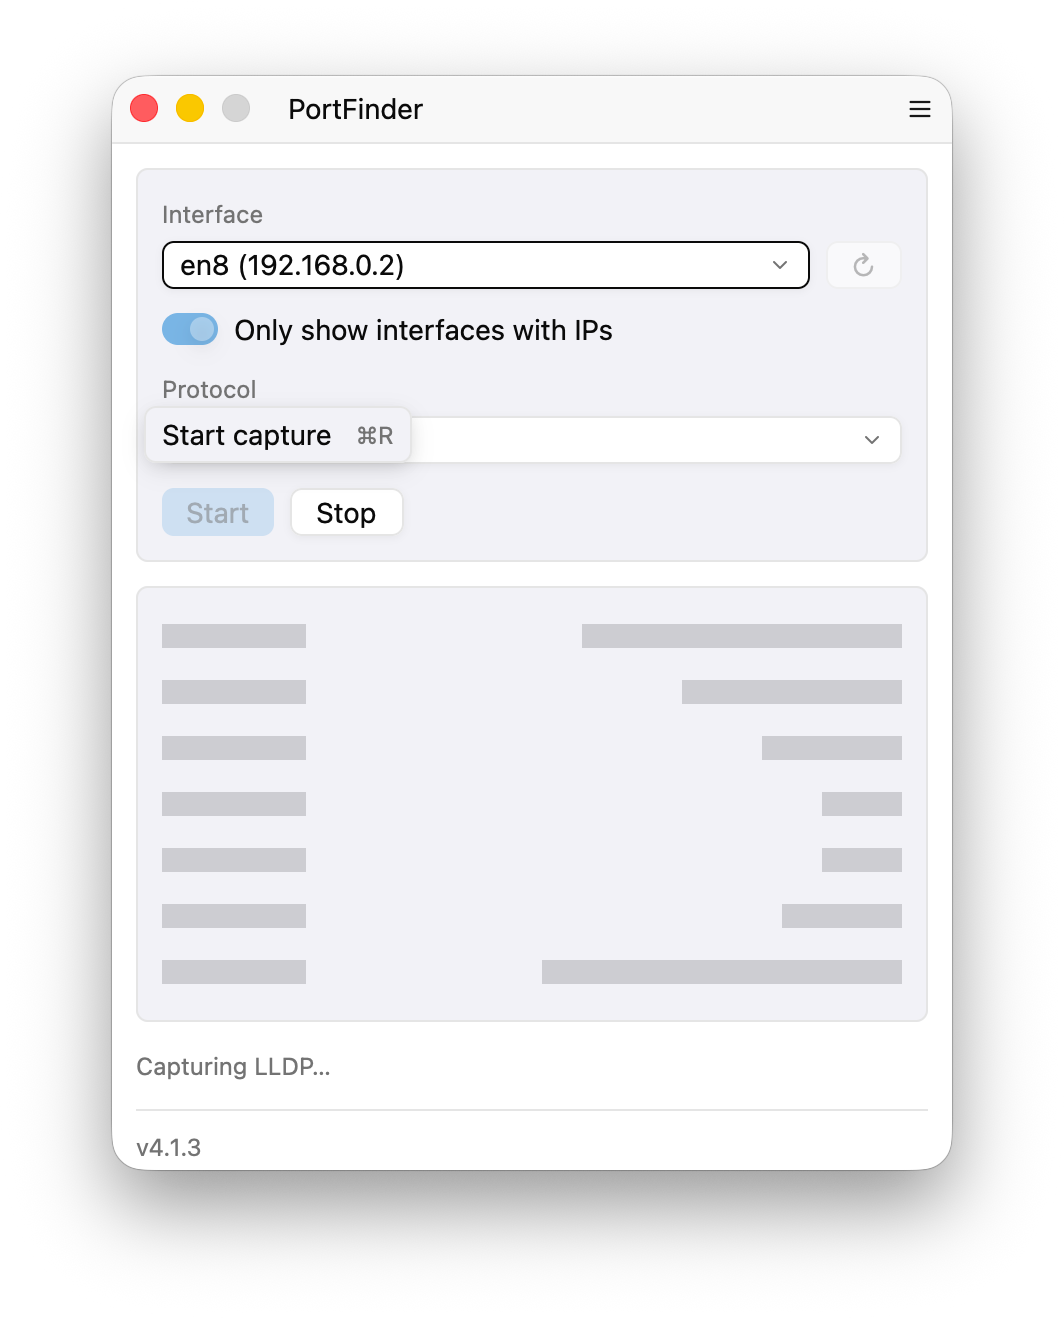
discovery-protocol = mndpand never speak LLDP. - Click Start. Most switches send a discovery packet every 30–60 seconds, so it usually takes a few seconds for the first frame to arrive.
- Read the result. Switch name, IP, port, VLAN, voice VLAN, MTU, and model populate the result card.
Each stage, on macOS:
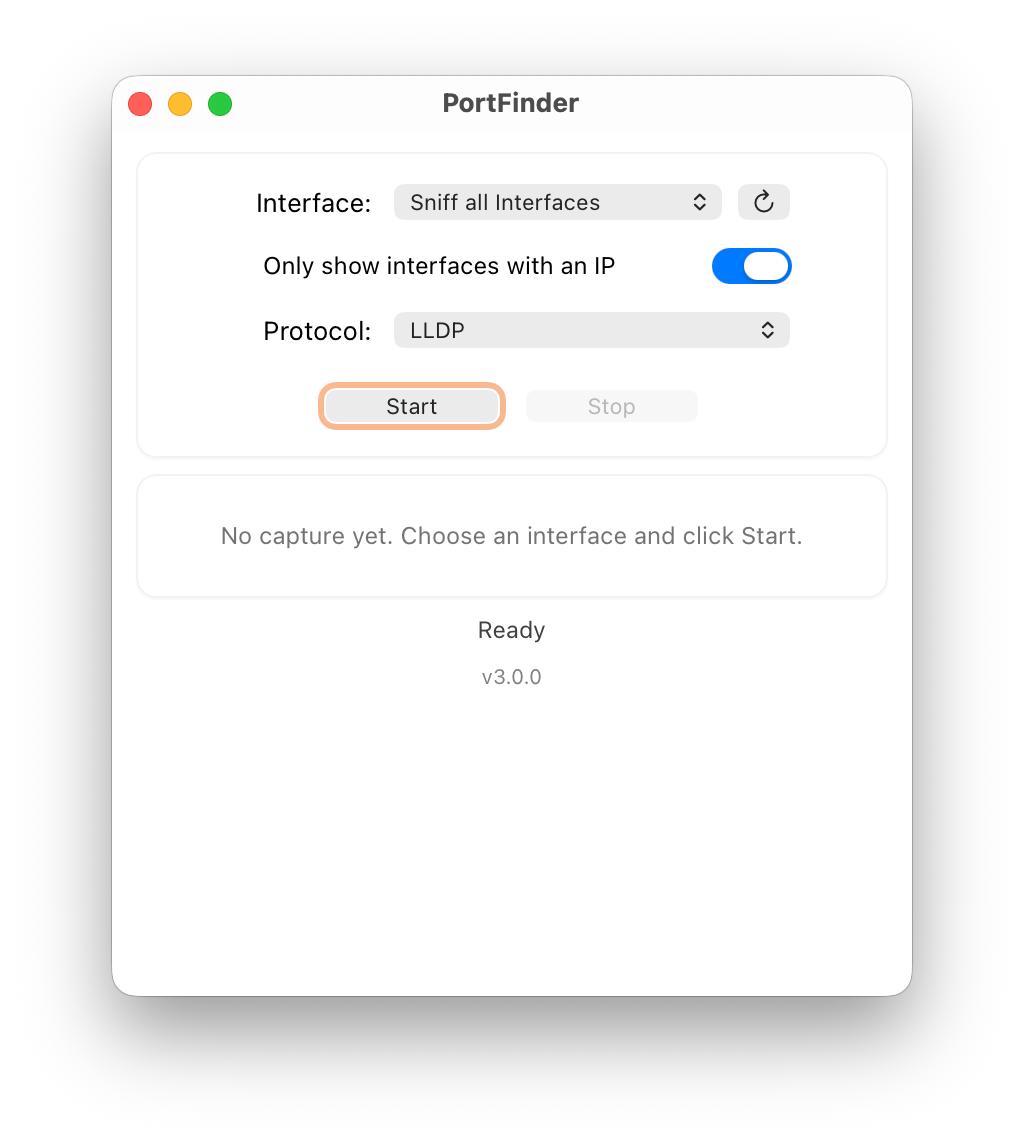
On each platform
Section titled “On each platform”Same workflow, different chrome — macOS is shown above.
Privilege warnings
Section titled “Privilege warnings”PortFinder shows a banner if it can't capture packets:
- macOS — click Install BPF Helper once. The app installs a
LaunchDaemonthat makes/dev/bpf*readable for members of theaccess_bpfgroup, which Wireshark also uses. - Linux — install the
.debor.rpmpackage. The postinstall setsCAP_NET_RAWon the binary so it doesn't needsudo. - Windows — install Npcap with "Allow non-administrators to capture" enabled.
Sniff all interfaces
Section titled “Sniff all interfaces”Selecting Sniff all Interfaces runs a capture on every non-loopback NIC in parallel and returns the first matching packet. Useful when you don't know which physical port is patched into the switch.
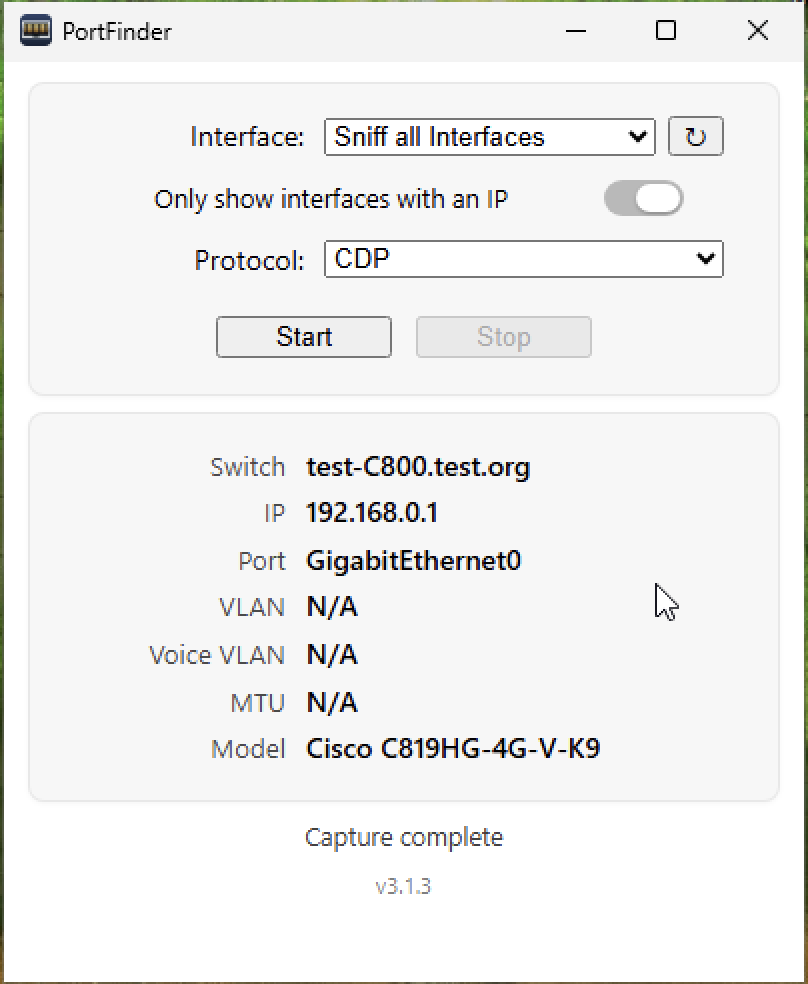
Result card
Section titled “Result card”After a capture lands you get seven rows: Switch Name, Switch IP, Switch Port, VLAN, Voice VLAN, MTU, Switch Model. Fields the switch didn't advertise render as a muted Not advertised.
- Click any value to copy that one field to the clipboard.
- Copy as JSON copies the full result as pretty-printed JSON — byte-identical to what
portfinder capture --jsonproduces, so you can paste it into a ticket or pipe it throughjq. - History (N) opens a popover with the last ten captures. Each row shows a relative timestamp ("2m ago · LLDP on en0 · Gi1/0/24") plus the switch name and IP. Left-click restores that capture to the card; right-click silently copies the entry as JSON.
History is session-scoped by default; flipping Save capture history in the settings menu writes it to disk so it survives restarts.
Keyboard shortcuts
Section titled “Keyboard shortcuts”| Action | macOS | Linux / Windows | |---|---|---| | Start / Stop capture | ⌘R | Ctrl+R | | Quit | ⌘Q | Alt+F4 |
The shortcut is also wired into the PortFinder application menu as Start/Stop Capture. It's inert while the settings popover is open, so the popover's controls keep arrow-key focus.
Settings
Section titled “Settings”A hamburger menu in the title bar opens the settings panel. The popover is grouped into Capture, Logging, About, and a folders row.
Capture
Section titled “Capture”- Save capture history — when on, the History popover persists to a
history.jsonfile alongsidesettings.json. Default OFF. Flipping ON snapshots the current in-memory deque to disk immediately, so quit + relaunch round-trips. Flipping OFF deletes the file; the in-memory deque stays for the rest of the session.
Logging
Section titled “Logging”-
Log level — slider with three discrete stops:
- Normal (info) — lifecycle events only: boot, capture start/stop, settings flips. The default.
- Verbose (debug) — adds per-event capture diagnostics ("PortFinder isn't capturing" debugging).
- Trace — adds per-pcap-tick noise (~20 Hz per interface). Almost always overkill; useful for libpcap timing questions.
The level applies live to every active logger, including any parallel
portfinder captureinvocation in another terminal. CLI-v/-vv/-qflags still override at runtime. -
Write debug log — toggles file logging. Default OFF — a fresh install never drops a log file anywhere until you flip the switch. When enabled, log lines go to the platform's conventional log directory and the toggle takes effect immediately (no relaunch). Rotates at 1 MiB to
portfinder.log.1.
The About → row opens a sub-page inside the same popover with version, GitHub link, GPL-3.0 license link, and a platform-specific capture-privilege status row (BPF helper on macOS, Npcap on Windows, "Capture access" on Linux). The privilege row is read-only status — installation flows live on the prominent banner up top.
Folders
Section titled “Folders”Two buttons reveal the relevant directories in your file manager.
| | Settings folder | Log folder |
|---|---|---|
| macOS | ~/Library/Application Support/PortFinder/ | ~/Library/Logs/PortFinder/ (Console.app picks this up automatically) |
| Linux | ~/.config/portfinder/ (XDG config dir) | ~/.local/state/portfinder/ (XDG state dir) |
| Windows | %APPDATA%\PortFinder\ | %LOCALAPPDATA%\PortFinder\Logs\ (Local, not Roaming) |
The settings folder holds settings.json and (when Save capture history is on) history.json. The log folder holds portfinder.log plus the rotated portfinder.log.1 if you've crossed the 1 MiB threshold.