GUI tour
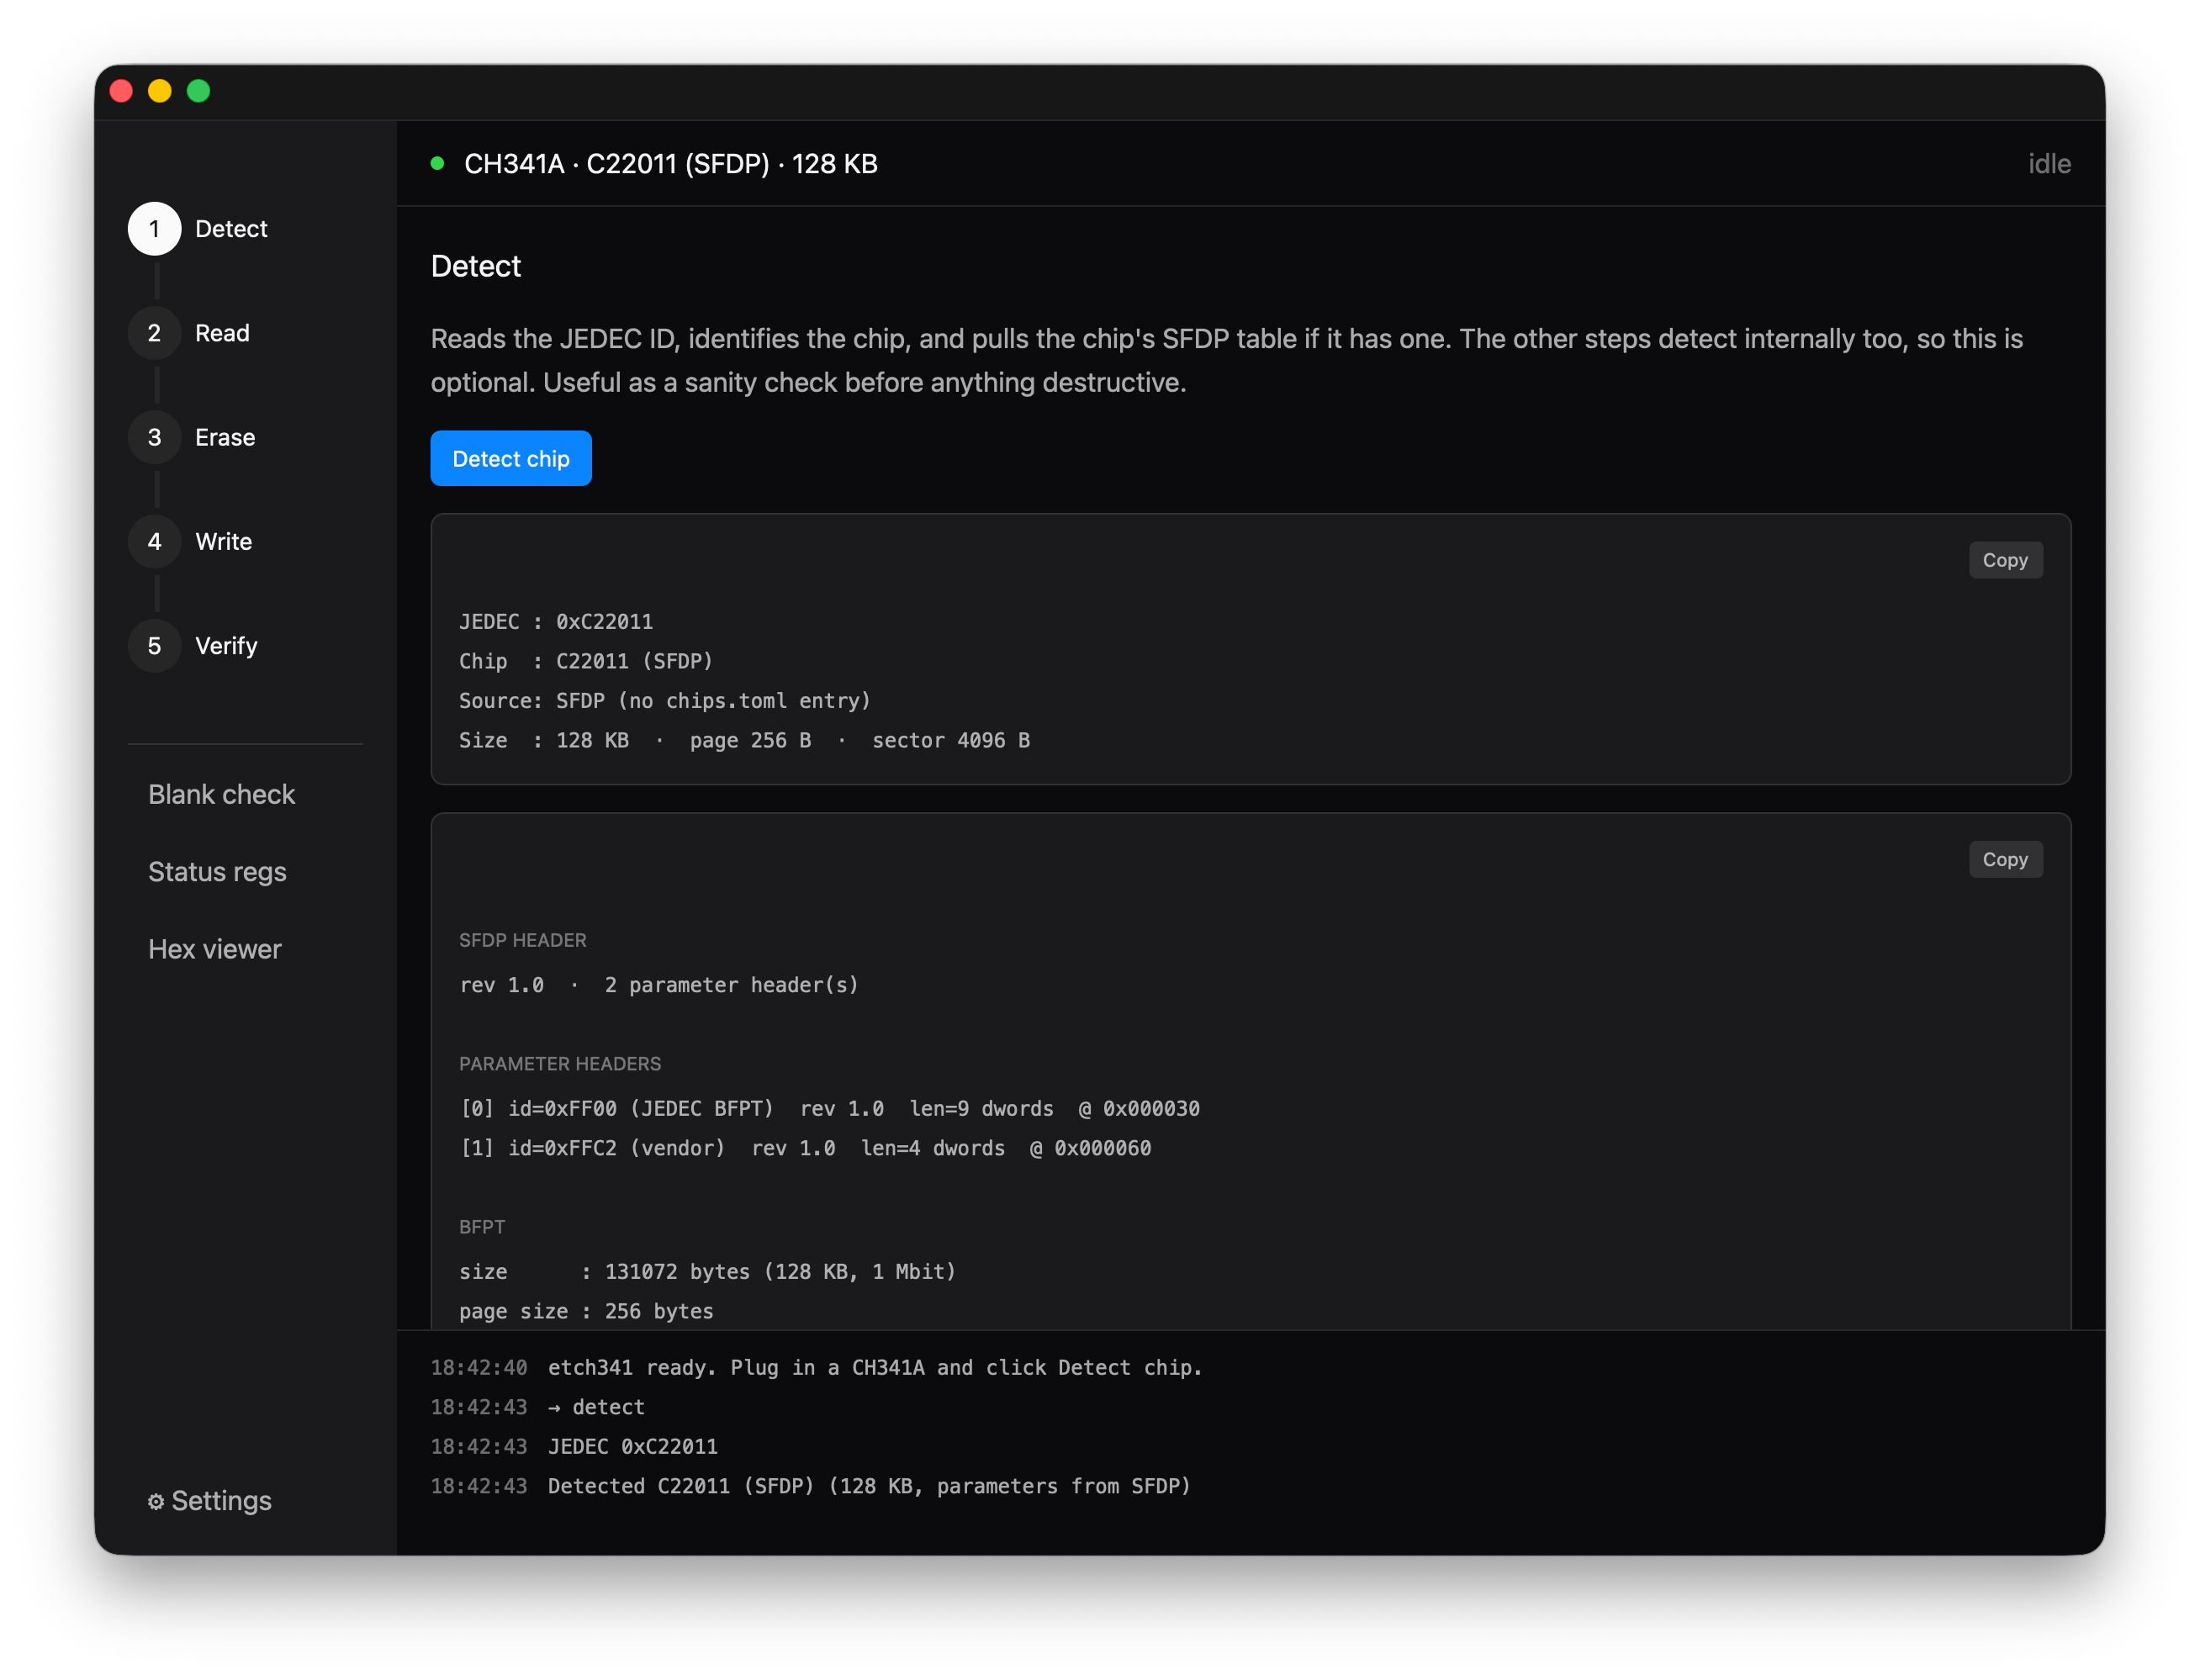
Launching the binary with no subcommand opens the desktop GUI. On
the released installers this is what double-clicking the app does
(or running it from the Start menu / gtk-launch etch341 on
Linux). From a source build, cargo run does the same.
Layout
Section titled “Layout”The window is split into three regions:
- Sidebar (left) — vertical pane selector. At the very top, a SPI / I²C bus toggle swaps the whole tool set between SPI flash and 24Cxx EEPROMs (see I²C EEPROMs). For SPI, the top half is a stepper showing the canonical workflow (Detect → Read → Erase → Write → Verify); click any step at any time, no enforced ordering. Below a thin divider sit the inspection / diagnostic tools (Blank check, Status regs, Security regs, Hex viewer), and ⚙ Settings is pinned to the bottom.
- Main pane (top right) — the current pane’s controls and content.
- Activity log (bottom) — chronological log of operations, results, and errors. Resizable: drag the splitter to give it more or less vertical space. The height is persisted across launches. Two chips in its top-right corner: ⧉ pops the log out into its own window, and × clears it (see Activity log).
The window’s own size + position is also persisted, so it opens where you left it.
Header
Section titled “Header”The top header always shows the connection state and the active operation’s progress bar (when one is running). Click the chip name to re-run JEDEC detection — useful after swapping chips without restarting.
Operation results
Section titled “Operation results”Every operation reports its outcome two ways: a line in the activity log (the running history), and a coloured result line in the pane itself — a green ✓ on success with a short summary (e.g. how many bytes were read or written and to where, or “Chip matches the file”) or a red ✗ on failure: a hardware error, a verify mismatch, or a blocked click like “Pick a chip first”. The result line clears when you switch panes, so it always reflects the pane in front of you. Detect, Status regs, and Security regs show their richer result card on success and fall back to the red ✗ line on error.
Detect
Section titled “Detect”The simplest pane. Click the “Detect chip” button → reads the JEDEC
ID via opcode 0x9F → looks up the chip in the embedded database.
The log shows the raw JEDEC bytes; the header shows the friendly
chip name + capacity once a match lands.
MISO floats high (returns 0xFFFFFF) means the chip isn’t
responding — typically clip orientation, missing VCC, or a held
HOLD#/CE# pin. MISO stuck low (0x000000) means an in-circuit
host controller is actively pulling the line low. See
Wiring + voltage for the recovery paths.
Chip database browser
Section titled “Chip database browser”The “Browse chip database” button opens the full catalogue in its own window — every bundled SPI flash and I²C EEPROM chip, with a vendor dropdown, a live name/JEDEC search, and a colour-coded Voltage column. It’s read-only and offline (the database is compiled into the binary), so you can keep it open beside the Detect result as a reference. In the “All vendors” view, SPI rows are grouped under per-vendor dividers.
Voltage is colour-coded so the parts that need care stand out:
- SPI shows each chip’s single rail as a traffic light — green 3.3V, amber 2.3V, red 1.8V — keyed to how much it minds a stock 3.3V rig. 1.8V parts need a 1.8V-capable programmer; connecting one to a plain 3.3V setup over-volts every pin.
- I²C 24Cxx are a wide-range family (~1.8–5.5V, commonly run at 3.3V or 5V on the CH341A’s jumper), shown in a dedicated blue to mark them as a tolerant range rather than a single rail.
The same listing is available headless via the CLI’s
etch341 chips
table.
Picks a known chip, reads its full contents to a file. The file is
named etch341-read-<date>_<time>.bin (local time, e.g.
etch341-read-2026-05-29_14-03-07.bin) and lands in your home
directory by default — change the folder in Settings → Read save
location. The Hex pane can then open that file for inspection.
Erase, Write, Verify
Section titled “Erase, Write, Verify”Each of these is arm-then-confirm: first click sets the button to “Click again to confirm” with an amber warning banner; second click within the same pane visit fires the actual destructive operation. Switching panes resets the arm state — there’s no way to accidentally erase a chip by mis-clicking once.
Write does erase + program + verify in one pass by default (the
CLI --no-erase / --no-verify flags aren’t exposed in the GUI
because the destructive variants are the rare cases).
The Hex pane has its own internal toggle between Hex view (per-byte hex + ASCII columns, virtualised so it scrolls 32 MB files smoothly) and Strings view (extracted printable ASCII runs, with offset on the left).
Find bar
Section titled “Find bar”The unified Find input sits below the Browse button and applies to both Hex and Strings views.
55 AAor55AA→ searches for the hex byte pair0x55 0xAA.Award BIOS→ searches for the ASCII string (case-insensitive on letters, exact for non-letters).0x10000→ jumps to that offset.
When matches are found, the chevron buttons step between them and a
counter shows i+1 / N. The matched bytes get a blue tint in the
Hex view; matching strings get bolded in the Strings view.
Byte selection + Cmd+C
Section titled “Byte selection + Cmd+C”Click a byte to anchor a selection. Drag (within a row, or across
rows) to extend it. Shift+click to extend the existing selection
without resetting the anchor. The footer shows
Selection: 0x{lo}..0x{hi} ({N} bytes). Cmd+C copies the
selected range as space-separated upper-case hex to the system
clipboard. Cmd+C only fires when the Hex pane is the visible pane
— typing Cmd+C in any Input still gets normal text copy.
Keyboard shortcuts
Section titled “Keyboard shortcuts”| Cmd+F (Ctrl+F on Linux/Windows) | Focus the Find input |
| Cmd+G / Cmd+Shift+G | Next / previous match |
| Cmd+C | Copy hex selection (Hex pane only) |
| Cmd+= / Cmd+- | Zoom the active view’s font in / out |
| Cmd+0 | Reset the active view’s font size |
(Ctrl on Linux/Windows for all of the above.) The Hex and Strings views have independent font sizes — the shortcut zooms whichever is visible, and the sizes also have controls in Settings → Hex viewer.
Status regs
Section titled “Status regs”Reads SR1 / SR2 / SR3 and decodes the standard bit fields. Same
view (and same logic) as the etch341 sr CLI command
— useful for diagnosing “writes silently failing” (block-protect
bits set) or “quad mode not enabled” (QE clear). SR1 works on any
SPI NOR chip; SR2 / SR3 follow the W25Q convention and show
“didn’t respond” on chips that don’t implement them. Raw hex
shown for every register so you can cross-check the datasheet.
Security regs
Section titled “Security regs”Reads, erases, and programs the chip’s three security registers
(Winbond W25Q / GigaDevice GD25Q convention, opcodes 0x48 /
0x44 / 0x42) — the same operations as the
etch341 otp CLI commands.
These commonly hold serial numbers, MAC addresses, or vendor keys.
Read dumps all three as offset / hex / ASCII; a register that’s
still blank reads back all 0xFF and collapses to a one-line note.
The card’s Copy button puts the full dump on the clipboard.
The Modify section targets one register (the radio selector)
and offers Erase and Write-from-file, each behind the same
two-stage arm/confirm as the Erase / Write panes — first click
arms, second fires. Both are read-back verified. Programming only
clears bits, so erase the register first for a clean write. The GUI
writes from offset 0; for a partial write at an offset, use the
CLI’s otp write --start. Erase and write are repeatable — etch341
never sets the one-time lock bits.
I²C EEPROMs
Section titled “I²C EEPROMs”The SPI / I²C toggle at the top of the sidebar switches the whole tool set to the 24Cxx EEPROM workflow. I²C has no JEDEC autodetect, so in place of a Detect step every I²C pane starts with a chip dropdown — pick the part (24C01 … 24C512) once and the choice follows you across panes. The panes mirror the SPI side:
- Scan — probes the bus (
0x08..0x77) and lists the 7-bit addresses that ACK. A 24Cxx with its address pins grounded shows at0x50. A blank EEPROM (all0xFF) can’t be detected this way — the CH341 never exposes the I²C ACK bit, so it reads like an empty bus; pick the chip and read it directly. - Read — dumps the whole chip to a timestamped file in your Read save location.
- Write / Verify — program from a file (Write verifies afterward) or compare against one without writing. Write is arm-then-confirm, same as the SPI destructive panes.
- Erase — writes
0xFFto every byte (EEPROMs have no sector-erase); also arm-then-confirm. - Blank check — confirms every byte reads back as
0xFF.
I²C runs at 100 kHz (the bus caps at 400 kHz — see the I²C page). The protocol is silicon-validated on a 24C02; the 2-byte-address parts (24C32+) and the bit-stuffed 24C04 / 08 / 16 are mock-tested but not yet confirmed on a chip. Full reference: Usage → I²C.
Settings
Section titled “Settings”The pane is configuration-only — the activity log is hidden while Settings is the active pane so the body has room to breathe. The installed version is shown next to the heading, and a small amber dot rides the ⚙ Settings sidebar item when a newer release is available (see Updates below). Every setting saves immediately. The sections:
- SPI clock speed — 20 / 100 / 400 / 750 kHz. The bus rate every CH341A op uses; the next op picks up the new value when it opens the device. (I²C ops cap at 400 kHz regardless — see the I²C page.)
- Read save location — where the Read pane writes its dumps. Defaults to your home directory; Browse to pick another.
- Window — restore window position on startup toggle. Off by default; when on, the window’s last bounds are snapshotted on graceful close and restored on next launch.
- Appearance — accent color. Pick one of eight swatches; the whole UI recolors live (buttons, selections, toggles, radio dots, sidebar). Button labels switch between dark and light per accent so they stay readable.
- Hex viewer — independent font sizes for the Hex and Strings
views, with
−/+steppers and a reset. Mirrors the Cmd/Ctrl +=/-/0shortcuts. - Log timestamps — show activity-log times in your local time zone or UTC. Storage is always UTC; this only changes the display, and it re-formats existing lines too.
- Updates — toggle the boot-time new-version check, see the current status, and View release / Check now. Detection only — it never downloads or installs. See Updates.
- Preferences file displays the on-disk prefs path
(
~/.config/etch341/prefs.tomlon Linux/macOS,%APPDATA%\etch341\prefs.tomlon Windows) with an Open folder button that pops the containing directory in the OS file manager (open/explorer/xdg-open).
Updates
Section titled “Updates”On launch (unless you turn it off in Settings → Updates), etch341 checks the project’s GitHub releases for a newer stable version. If one exists, a small amber dot appears on the ⚙ Settings sidebar item, and Settings → Updates shows the available version with a View release button that opens the release page in your browser.
It’s detection only — etch341 never downloads or replaces anything on disk; you choose whether and when to install. The check runs on a background thread, so a slow or offline network never stalls the UI (it just finds nothing). Check now re-runs it on demand. Pre-releases are ignored — only stable releases trigger the dot.
Activity log
Section titled “Activity log”Every operation logs HH:MM:SS message lines, scrollable, with the
most recent at the bottom. Long lines wrap. Drag the splitter above
the log to resize it; the height persists. Timestamps render in UTC
by default — flip Settings → Log timestamps to local time.
Two chips sit in the log’s top-right corner:
- ⧉ Pop out detaches the log into its own window. It stays live — new lines stream into it and it follows the tail (unless you’ve scrolled up to read history). Closing the window re-docks the log; while it’s popped out, the active pane takes the full height.
- × clears the log.